
Housing Market Analysis

Bedford experienced a strong increase in population during the COVID pandemic, likely attributed to younger populations and others who had left returning home. Since then, the population has declined slightly, but remains fairly steady overall, around 12,900 people.

When looking at household composition among those with children, only approximately 20% of households in Bedford have children. This is compared to 30% across the MSA, indicating there is a pervasive lack of faith in the city’s opportunities for children. However, among the 20% of households with children, the vast majority are of schooling age, pointing to a belief in the school system among Bedford’s actual residents, who are keeping their children in the city for their education. While this is encouraging news, the lack of households with children in the city overall is a key socioeconomic issue.

Bedford’s housing stock is typical of a first-ring Cleveland suburb, primarily comprised of older, single-family homes. While this has allowed the city’s housing to remain relatively affordable while providing locals with a way to create and preserve wealth, increases in the cost of maintaining these older homes, due to inflation and simply the age of the home, has created a legitimate squeeze on current/previous residents, as we will come to see.


Part of this squeeze comes from buyers seeking profit from the local housing market. Northeast Ohio’s Eastside has notoriously been a target for corporate landlords, large and small. Per the county’s property database, more than one of every ten residential properties is owned by an LLC, and 26% of all residential property owners have mailing addresses not within Bedford.
While Bedford’s housing prices and rents fall far below national averages, things are not always as affordable as they seem when compared to the rest of Cuyahoga County. Bedford’s housing prices are far below the county average as of 2023 ($124,900 vs. $183,200), but rentals are slightly higher ($1,061 vs. $1,005). These figures point to the fact that the less affluent Bedford residents (typically renters) are not experiencing the same affordability advantage as their more affluent homeowner counterparts. Renters are stuck, but homeowners are seeking out Bedford’s affordability advantage, which is disappearing for locals and longtime residents as newcomers move into the city. Several additional key trends help corroborate this phenomenon and reveal additional market trends.

Bedford’s economy is experiencing “K-shaped” growth, like the rest of the nation. There is a clear line drawn between the typical “American Dream” class of residents, owning single family homes and multiple cars, who seek out Bedford due to its affordability (which ironically is disappearing), and the residents of Bedford’s yesteryear, who rely on public transit, have older, smaller, paid-off homes, and who are losing the sense economic refuge that Bedford has been in recent memory, as it falls in line with the broader affordability crisis taking shape.
As we look beyond pricing comparisons, the first additional sign of this phenomenon is in transportation changes from 2018 to 2023. There has been a sharp increase in households with either no vehicles available, or two or more vehicles available. With personal vehicle ownership being a strong indicator of personal wealth, we can surmise that there’s an increase in residents who are struggling to make ends meet, being forced to sell or give up their cars, as housing prices continue to increase. And on the other end, wealthy households with several vehicles are taking their place.


We can also look at foreclosures, which moderated after a recovery from the 2008 crisis. During the crisis, defaults peaked at around 200/year, and while they have come down from all-time highs, are still significantly higher than before the onset of the housing crash. This portrait of the housing market corroborates suggestions that residents are being squeezed by increased utility bills, property valuations, and maintenance costs, with more affluent residents and other parties coming in on the other side to scoop up these homes at a steep discount relative to their incomes and more affluent surrounding suburbs.
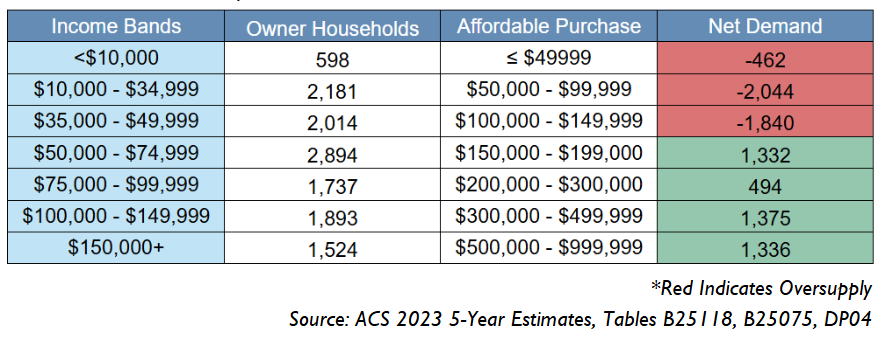

These results show net rental demand at the very low level, and at around 100% - 120% of AMI ($63,467 in the PMA) for both rental units and for-sale homes. For new home ownership opportunities, there is significant demand around 100% AMI and at all incomes above that level. While this may mean new housing is very much in need, it may also mean that income growth is outpacing housing value increases in the area. Affordability well above the AMI is less reliable, as households do not consume housing at their maximum level of affordability as incomes rise. There is also a need to evaluate the current physical quality of the housing market and make recommendations on what needs immediate rehabilitation.
Other housing data in the PMA is important; net demand does not paint the entire picture:
85% of housing stock built before 1980.
Around 8% of housing is vacant.
70% of all housing in the market area is detached, single family housing.
59% of households are owned.
Average household size is 2.2 for owners, and 2.5 for renters.
This analysis also does not account for additional demand that new development is likely to draw from outside of the PMA. New development tends to have this effect, although the draw is not as strong as a metropolitan area with more lifestyle amenities and work opportunities present. Economic development also bolsters new housing development as new jobs draw workers to the area. If workers for newly created jobs are already living in the region, they may seek to relocate for the combination of a reduced commute and new development.
-
Cuyahoga County. CuyahogaGIS Hub, geospatial.gis.cuyahogacounty.gov/.
ESRI (2023). ArcGIS Business Analyst, Drive-Time Analysis
NEOCANDO. Harnessing Data for Social Good, neocando.case.edu.
Ohio Department of Education and Workforce (2024). Ohio School Report Cards. https://reportcard.education.ohio.gov/
U.S. Bureau of Labor Statistics (2023). Consumer Expenditure Survey. https://www.bls.gov/cex/tables
U.S. Census Bureau, U.S. Department of Commerce. "ACS Demographic and Housing Estimates." American Community Survey, ACS 5-Year Estimates Data Profiles, Table DP05, 2015-2023.
U.S. Census Bureau, U.S. Department of Commerce. "Educational Attainment for the Population 25 Years and Over." American Community Survey, ACS 5-Year Estimates Detailed Tables, Table B15003, 2023.
U.S. Census Bureau, U.S. Department of Commerce. "Employment Status." American Community Survey, ACS 5-Year Estimates Subject Tables, Table S2301, 2023.
U.S. Census Bureau. "Gross Rent as a Percentage of Household Income." American Community Survey, ACS 5-Year Estimates Subject Tables, Table B25070, 2018 & 2023.
U.S. Census Bureau, U.S. Department of Commerce. "Occupancy Characteristics." American Community Survey, ACS 5-Year Estimates Subject Tables, Table S2501, 2023.
U.S. Census Bureau, U.S. Department of Commerce. "Occupation by Sex for the Civilian Employed Population 16 Years and Over." American Community Survey, ACS 5-Year Estimates Subject Tables, Table S2401, 2023.
U.S. Census Bureau, U.S. Department of Commerce. "Selected Economic Characteristics." American Community Survey, ACS 5-Year Estimates Data Profiles, Table DP03, 2023.
U.S. Census Bureau. "Physical Housing Characteristics for Occupied Housing Units." American Community Survey, ACS 5-Year Estimates Subject Tables, Table S2504, 2018 & 2023.
U.S. Census Bureau. "Selected Housing Characteristics." American Community Survey, ACS 5-Year Estimates Subject Tables, Table DP04, 2018 & 2023.
U.S. Census Bureau, U.S. Department of Commerce. "Tenure by Household Income in the Last 12 Months" American Community Survey, ACS 5-Year Estimates Data Profiles, Table B25118, 2023.
U.S. Census Bureau. "Value." American Community Survey, ACS 5-Year Estimates Subject Tables, Table B25075, 2023.
U.S. Census Bureau. "Year Structure Built." American Community Survey, ACS 5-Year Estimates Subject Tables, Table B25034, 2023.